When someone asks "how did you get that number?" you can walk them through it.
Labor, overhead, profit, markups — every component is itemized and exportable.
Every number has a trail.
Every project in Margin shows the full cost breakdown: labor, overhead allocation, contractor costs, expenses, markups, and profit. Nothing is hidden in a formula or buried in a cell reference. The number you see is the number you can explain.
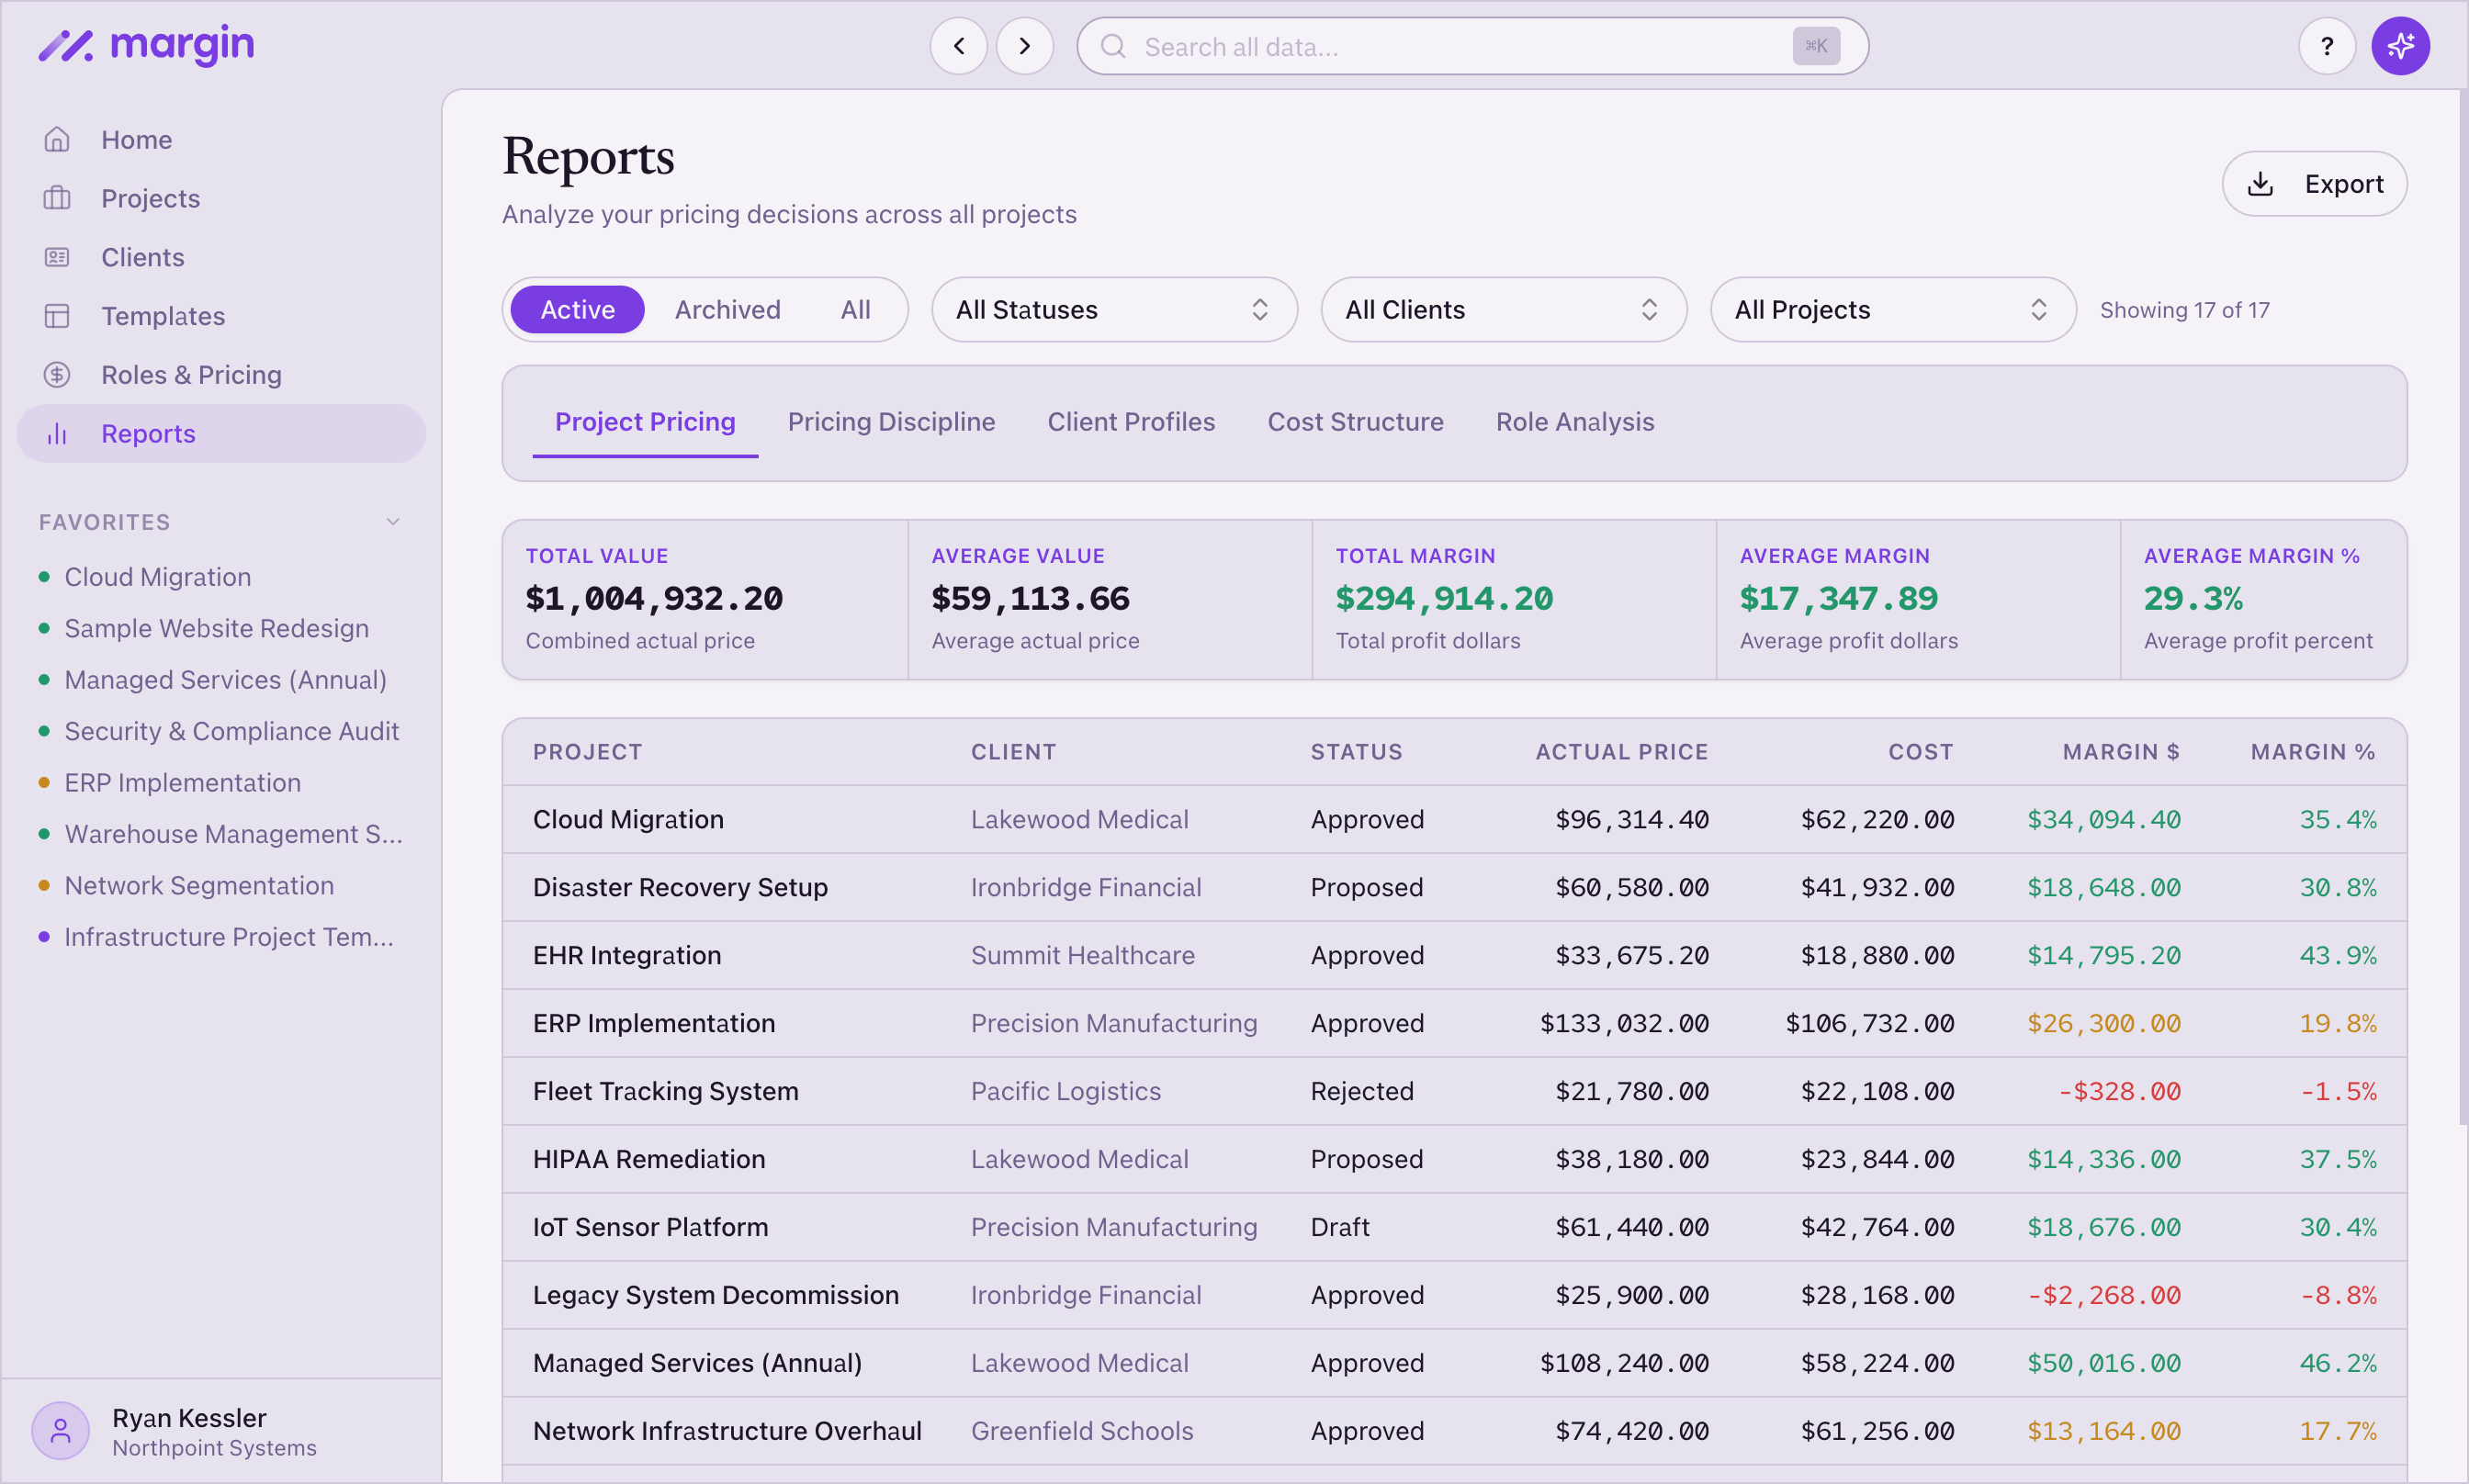
Reports extend that transparency across your portfolio. Five views — Projects, Roles, Clients, Pricing Discipline, and Cost Breakdown — give you the data by whatever dimension matters. See which roles are consistently underpriced. See which clients generate the most revenue versus the most margin. See whether your team is systematically discounting below target.
The AI assistant reads your data and surfaces patterns you might not spot at a glance: an activity priced below cost, revenue concentrated in one client, an expense with zero markup. It calculates specific fixes — the price increase needed to hit target, or the hours to cut on the highest-cost role. Export any project or report to PDF, Excel, or Word in the format your client or CFO needs.
Five report views. AI analysis. Full export.
Transparency is built into three layers:
- Project-level breakdown — every project shows its cost structure: base fee, overhead, profit, and suggested price. Each activity within the project has its own breakdown and health score.
- Portfolio reports — five tabs covering Projects (total and average value, margin), Roles (hours, cost, revenue per role), Clients (revenue and margin per client), Pricing Discipline (deviation from target), and Cost Breakdown (labor, contractors, expenses, overhead by category). Summary cards, sortable tables, cascading filters.
- AI assistant — reads your full dataset and highlights what matters. Cross-project comparison, anomaly detection, profitability analysis with specific margin gap calculations. Context-aware: on a project page it analyzes that project, on reports it gives an executive summary.
Export filtered data or everything. Single report tab or all tabs. PDF for clients, Excel for the finance team, Word for proposals. The data leaves Margin in whatever format the conversation requires.
Defensible numbers, start to finish.
Every number has a story. Margin shows it.
Full breakdown, reports, and exports — so you can explain and defend every price.
Try Margin free